Content · Curiocity
10 of the best things to do in & around Edmonton this week (May 18–24)
From concerts and light displays to markets and hockey games, here are 10 things to do this weekend…
184KPageviews
96KScrolled
1m 23sAvg. Time
FOR PUBLISHERS & AGENCIES
|
Momently pulls in your actual content, articles, social posts, newsletters, ads, and connects each piece to its performance data across every platform. Build campaign reports, live dashboards, and insights no other tool can.


NOT JUST DATA. CONTENT.
Most analytics tools pull numbers from APIs and chart them. Momently pulls in the content itself, every article, every social post, every newsletter, every ad creative, and connects it to performance data across every platform. Your reports show the actual work alongside the results.
We crawl your articles, pull your social posts, newsletters, and ad creatives. Not just the metrics. The actual content.
Each piece of content is linked to its performance across every platform: GA4, social, ads, email, newsletters, programmatic.
Build branded campaign reports that show the creative alongside the numbers. Share live dashboards instead of stale PDFs.
Because we have your content, AI can pick out signals no other tool can see: topic, sentiment, audience level, entities, and more.
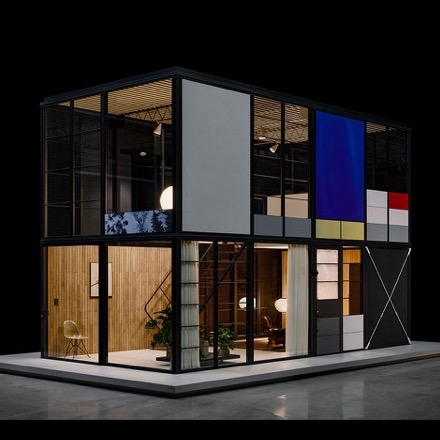
At Fairmont Chateau Lake Louise's new BASIN Glacial Waters spa, thermal pools and glacier views make staying still the most unforgettable way to experience the Rockies.
Because we have the content, AI can extract


CAMPAIGN REPORTS
Campaign reports with the actual content, the article, the ad, the social post, right next to the performance data. Branded, automated, and shareable.
Every report shows the actual creative alongside impressions, clicks, engagement, and conversions. Not just charts.
Client logos, campaign names, custom colors. Every report looks like it took hours to design.
Pixel-perfect PDF generation. Or share a live link that updates in real time.
A Facebook ad, an Instagram Reel, and a newsletter in the same campaign? One report covers all of it.
Share reports with anyone via a link. No login required. No stale PDFs.
Download raw data as a ZIP of CSVs when you need it.
DASHBOARDS
Social, ads, web, newsletters, programmatic, CMS. Build dashboards that pull from every source your business runs on, and share them with clients, teams, or advertisers.
See the actual posts, articles, and ads inside your dashboard, not just the metrics. Scoreboard KPIs, charts, tables, and creative galleries in one card.
Instagram, Facebook, TikTok, GA4, GAM, newsletters, CMS. Mix sources in any combination.
Manage multiple publications, clients, or brands from a single workspace. Filter by property, total across the network.
Give clients, advertisers, or leadership a live dashboard URL. Always current, no login required.
Drag-and-drop cards in a resizable grid. Build the view that tells your story.
Email dashboard summaries on a schedule: daily, weekly, monthly, or quarterly.
AI + APIs
Because Momently has your actual content (not just the metrics), AI can pick out structured fields no other analytics tool can see. Use them in dashboards, reports, or via API to power search, recommendations, and discovery on your own site.
Learn more{ "query": "climate policy", "filters": { "sentiment": "positive", "section": "Environment" } }
INTEGRATIONS
Connect all the platforms your team already uses. Data flows in automatically.
CASE STUDY
See how leading media companies use Momently to bring all their analytics together and impress their clients.
BUILD WITH US

Join publishers and agencies who use Momently to build campaign reports, live dashboards, and insights that no other tool can deliver.